2D Contouring and Color Maps

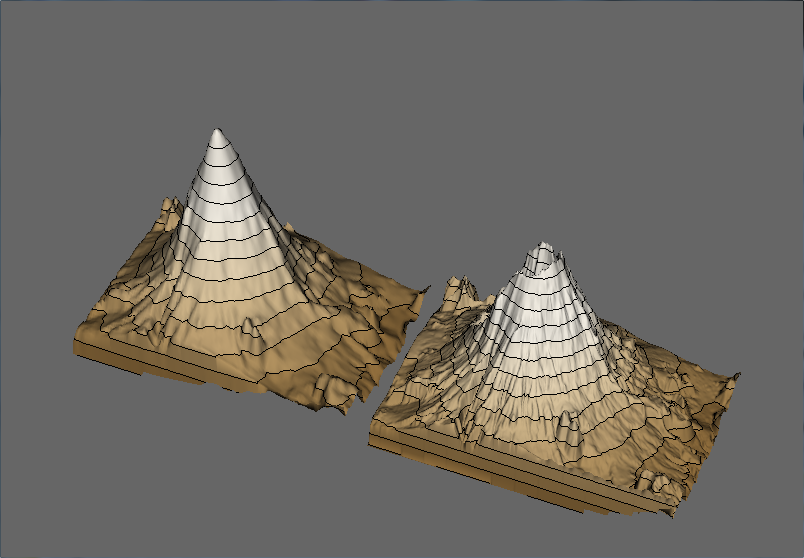
The purpose of this project was to visualize how Mount St. Helens was changed by the eruption of 5/18/80. I used Historic Digital Elevation Models (DEM) from the United States Geological Survey website. The terrains have a color map to show the elevations and also has 2D contours at proper elevations to highlight distinct heights. The terrains were drawn side by side for comparison purposes.

You might be interested in …

Shadow Map

The scene is filled with 3D objects featuring ambient and diffuse lighting. The objects cast shadows on each other based on the light using shadow maps. The user may move the light source around.

Read More

Deformable Bodies

A deformable bodies simulator based on a standard non-linear strain finite element simulation as in O’Brien et al. [1999]. This approach required incredibly small time steps.

Read More

Procedurally Generated Terrain

The ground is procedurally generated using a random midpoint method and smoothed using a neighborhood smoothing filter. The trees were generated by different procedural rules. The scene uses OpenGL material and lighting.

Read More